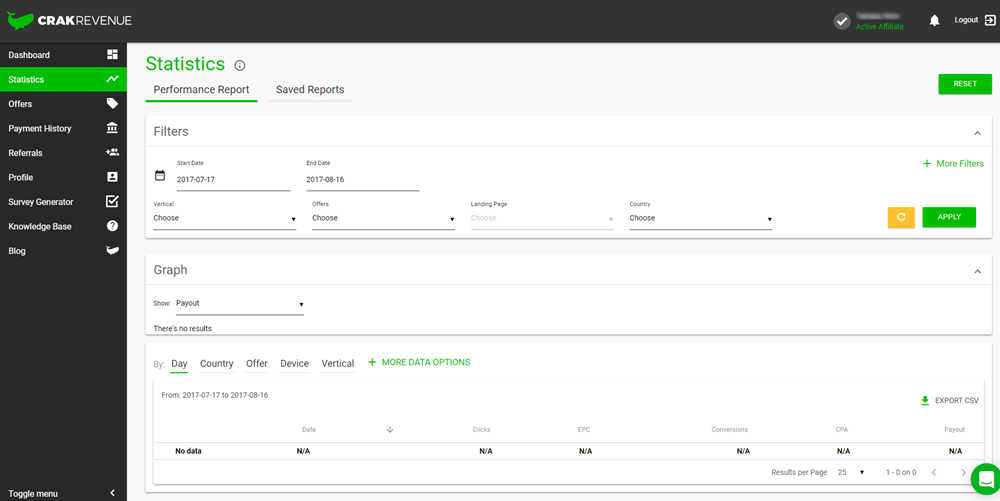
Easily customize your stat reports with the following options:
Date Range
Select which days the results should cover. Choose a predefined range or set specific Start and End dates. Click the Apply Filter button to enable your selection.
Filters
Filtering allows you to include specific data in your report. You can include or exclude results from single or multiple offers, countries, browsers, etc.
If you are using one of the customizable Sub-IDs to identify or label a traffic source or campaign from within your stats — now you can use one of our available Filters on that specific Sub-ID to narrow the results down on that particular source/campaign.
- Available filters are by: Vertical, Brand, Offer, Landing Page, Country, Niche, Browser/Device, Payout Type, Sub-ID 1 – 5, EPC, CTR, Payout, Impression, and by Clicks or Conversions.
Columns
Use the “More Columns” section to add additional details & criteria to the results displayed.
There are two types of columns you can add: Measures and Dimensions.
Measures are calculated metrics. Available measures include…
- Impressions: The total number of impressions
- CPM: Cost Per Mile. Payout per thousand Impressions.
- CTR: Click-Through-Rate. Percentage of clicks on the number of Impressions.
- Clicks: Total number of clicks
- EPC: Earnings Per Click. Equal to the Payout divided by the number of Clicks.
- CR: Conversion rate. Percentage of conversions on the number of Clicks.
- Conversions: Total number of conversions (includes all types of conversions: opt-in, PPS, Revshare…).
- CPA: Cost Per Acquisition. Equal to the Payout divided by the number of Conversions.
- Payout: Money earned from conversions.
Dimensions will offer a breakdown of the results per the specified dimension selected.
For example: if you show the Date dimension along with the Offer dimension, you will see one line of results for each Date/Offer combinations.
Available Dimensions are: Offer ID, Ad Group ID, Sub ID 1- 5, Offer, Ad Group, Date, Year, Month, Week, Hour, Landing page, Source, Country, Browser / Device, Payout Type, and Creatives.


